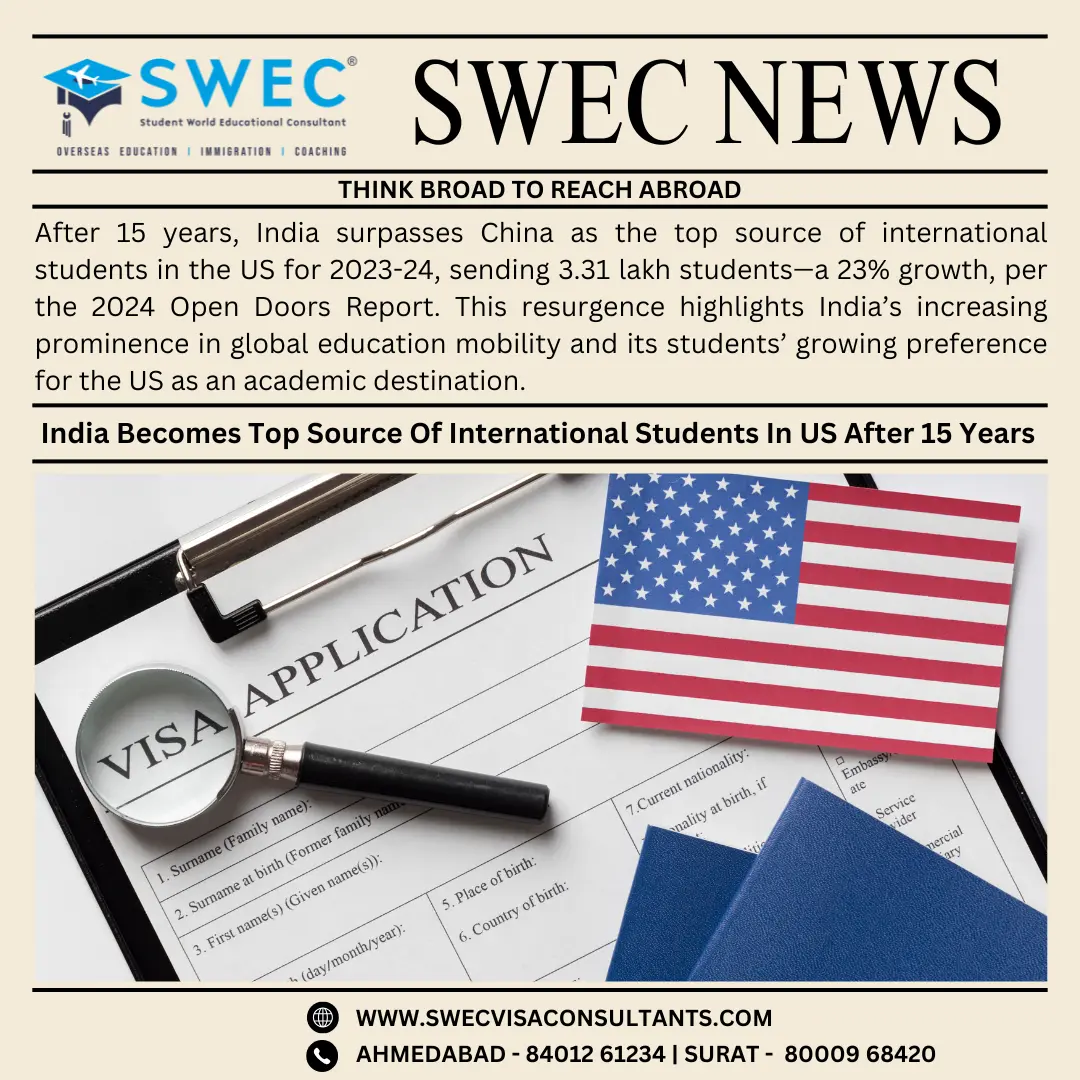
After a 15-year gap, India has regained its position as the top contributor of international students in the United States, surpassing China in the 2023-24 academic year. According to the Open Doors Report on International Educational Exchange 2024, India sent 3.31 lakh students to the US, marking a 23% year-over-year growth. This resurgence highlights India’s increasing prominence in global education mobility and its students’ growing preference for the US as an academic destination.
For Indian students aspiring to study abroad, SWEC Visa is your trusted partner in navigating the complex visa application process. With years of expertise, SWEC helps students secure admissions to top universities worldwide, ensuring a smooth journey toward achieving their academic goals.
Key Highlights of Indian Students in the US
Surge in Numbers
- The total number of Indian students in the US climbed from 2.68 lakh in 2022-23 to 3.31 lakh in 2023-24.
- This growth was primarily driven by graduate program enrollments and a surge in Optional Practical Training (OPT) participants.
Notable Growth Segments
- Graduate Programs
- Graduate enrollment witnessed a significant increase of 19%, with 1.96 lakh students pursuing advanced studies.
- This makes graduate programs the most sought-after academic level among Indian students in the US.
- Optional Practical Training (OPT)
- Participation in OPT programs surged by 41%, reaching 97,556 students in 2023-24.
- OPT allows international students to gain practical work experience in their fields of study post-graduation.
- Undergraduate Programs
- Undergraduate enrollments also saw steady growth, with 36,053 students, representing 10.9% of Indian students in the US.
Economic Contributions
Indian students played a critical role in the US economy in 2023, contributing $11.8 billion out of the total $50 billion from international students.
Institution Type Preferences:
- Public Universities: 64.5% of Indian students chose public institutions, known for their affordability and diverse programs.
- Private Universities: 35.5% opted for private universities, which are often recognized for specialised programs and research opportunities.
Popular Fields of Study:
- Mathematics and Computer Science: 42.9% of Indian students chose this rapidly growing field.
- Engineering: 24.5% pursued engineering courses, reinforcing India’s reputation for producing world-class engineers.
- Business and Management: 11.2% enrolled in management-related programs.
- Physical and Life Sciences: 5.4% opted for these specialized areas of study.
SWEC Visa, based in Ahmedabad and Surat, specializes in helping students secure admission to graduate, undergraduate, and OPT programs. Our experienced team simplifies every step of the visa process, ensuring a higher success rate for student visas.
A Broader Perspective on International Students in the US
Record Numbers in 2023-24
- The United States hosted an all-time high of 11.26 lakh international students in the 2023-24 academic year, a 7% increase from the previous year.
- Together, India and China contributed 54% of the total international student population in the US.
- India: 3.31 lakh students (+23%).
- China: 2.77 lakh students (-4%).
Economic Impact
- International students collectively contributed over $50 billion to the US economy in 2023, with Indian students accounting for 20% of this total.
Geographical Trends
- Top US Destinations for Indian Students:
- Texas
- New York
- California
- Massachusetts
- Illinois
- States like Missouri (+35%), Michigan (+14%), and Illinois (+13%) saw notable growth in international student numbers.
Popular Disciplines for All International Students
- STEM Fields:
- Mathematics and Computer Science (25%).
- Engineering (19%).
- Others:
- Business and Management (14%).
- Physical and Life Sciences (8%).
Global Mobility Trends
The report highlighted that Sub-Saharan Africa achieved the highest growth rate among all regions for the second consecutive year, with a 13% increase in student mobility.
Among the top 25 countries sending students to the US, eight nations achieved record-high enrollments, including:
- Bangladesh
- Colombia
- Ghana
- India
- Italy
- Nepal
- Pakistan
- Spain
Scott Weinhold, a senior official in the US State Department’s Bureau of Educational and Cultural Affairs, emphasized the transformative impact of international education:
“The experience of studying in the United States not only shapes the lives of individuals but also the future of our interconnected world. The ties formed between the US and international students today are the foundation for future business, trade, science, innovation, and government relations.”
Statistical Overview
The following tables summarize key enrollment trends:
Overall International Student Enrollment in the US
| Year | Total International Students | Total US Enrollment | % of International Students | % Change from Previous Year |
| 2023-24 | 11,26,690 | 1,89,39,568 | 5.9% | 6.6% |
| 2022-23 | 10,57,188 | 1,89,61,280 | 5.6% | 11.5% |
| 2021-22 | 9,48,519 | 2,03,27,000 | 4.7% | 3.8% |
| 2020-21* | 9,14,095 | 1,97,44,000 | 4.6% | -15% |
| 2019-20 | 10,75,496 | 1,97,20,000 | 5.5% | -1.8% |
| 2018-19 | 10,95,299 | 1,98,28,000 | 5.5% | 0.1% |
*Note: Between 2020-21 and 2022-23, international students studying online from outside the US were included.
Indian vs Chinese Students in the US
| Year | Total Indian Students | Total Chinese Students | % Increase (India) | % Decrease (China) |
| 2023-24 | 3,31,602 | 2,77,398 | +23% | -4% |
| 2022-23 | 2,68,923 | 2,89,526 | +34.9% | -8.8% |
| 2021-22 | 1,99,182 | 2,90,086 | +18.8% | -5.2% |
Why Indian Students Prefer the US
- Top-notch Education: The US is home to some of the world’s best universities, offering unparalleled opportunities in research and innovation.
- Diverse Course Options: Fields like Mathematics, Computer Science, Engineering, and Business remain top choices, with STEM programs particularly favoured.
- Post-Graduation Opportunities: Programs like OPT and H-1B visas make the US a promising destination for students aiming to build their careers abroad.
At SWEC Visa, we guide students through the process of choosing the right program, preparing application documents, and securing visas, making their dreams of studying abroad a reality.
How SWEC Visa Helps Indian Students Excel
- Comprehensive Counseling:
At SWEC, we assess each student’s academic background, career goals, and preferences to recommend the best universities and courses. - SOP and Document Assistance:
Our team provides professional guidance in preparing Statements of Purpose (SOPs), recommendation letters, and other essential documents. - Visa Application Support:
With expertise in US student visas, we ensure all forms are correctly filled and submitted on time, minimizing the chances of rejection. - Pre-Departure Support:
We assist students with travel planning, accommodation, and orientation to make their transition to the US seamless.
Success Stories with SWEC Visa
Every year, SWEC Visa helps thousands of students from Ahmedabad, Surat, and across India secure admissions to top US universities. Our unmatched expertise and personalized guidance have made us a leading name in student visa consultancy.
Join the growing list of students who have achieved their dreams of studying abroad with a SWEC Visa.
Conclusion
India’s re-emergence as the top source of international students in the US underscores its growing educational aspirations and the increasing preference for globally renowned institutions. This shift reflects not only the academic ambitions of Indian students but also the strengthening of educational ties between India and the US, fostering mutual economic and cultural benefits.
